Showing posts with label NASA. Show all posts

Thursday, April 11, 2019

Black Holes, Einstein, MIT and Space all validated by the work of a woman - Katie Bouman, Computer Scientist, the unsung heroine


Katie Bouman of MIT not only rocked the world by giving us the first picture of an actual Black Hole this week, but she proved Einstein's famous Theory of Relativity in the process.

[Publisher's note - as a member of the Marvin Minsky MIT Society of the Mind, and we miss him a great deal, all Americans should take pride in the role MIT and our young people play with their enormous contributions to the future of our world.  Jim Putnam]     

Yahoo Lifestyle
The first image of a black hole was brought to you by Katie Bouman — and Twitter is making sure no one forgets it
Yahoo Lifestyle Paulina Cachero,Yahoo Lifestyle 16 hours ago 


A network of eight radio observatories on six mountains and four continents observed a black hole in Messier 87, a supergiant elliptical galaxy in the constellation Virgo, on and off for 10 days in April of 2017 to make the image. (Photo: Dursun Aydemir/Anadolu Agency/Getty Images)

What once was a figment of amorphous scientific predictions finally became a reality on Wednesday after scientists released the first-ever photograph of a black hole. While much of the public was awestruck by the long-anticipated photo, others were making sure that the woman behind this remarkable moment— computer scientist Katie Bouman—doesn’t get lost in history books.

Bouman is a postdoctoral fellow working with the Event Horizon Telescope team that released the revolutionary photograph. Bouman also led the development of a new algorithm to produce the first-ever image of a black hole as a grad student at MIT's Computer Science and Artificial Intelligence Laboratory three years ago. Her groundbreaking algorithm stitched together “data collected from radio telescopes scattered around the globe,” reported MIT News.
“Just like how radio frequencies will go through walls, they pierce through galactic dust. We would never be able to see into the center of our galaxy in visible wavelengths because there’s too much stuff in between,” Bouman told MIT News in 2016. “[Taking a picture of the black hole in the center of the Milky Way galaxy is] equivalent to taking an image of a grapefruit on the moon, but with a radio telescope.”
The fruits of her labor were only released on Wednesday. But, as news broke about the monumental discovery, Bouman’s crucial contribution to the project appeared to go largely overlooked. Many organizations credited the entire Event Horizon Telescope team who worked to capture the image and praised Albert Einstein’s theories on general relativity for predicting what the black hole might look like.

But, people online are making sure Bouman doesn’t become yet another hidden figure. Users posted photos of Katie and asking people to give the trailblazing scientist credit— like a Nobel Prize.
“BBC News, Could Katie get a mention in the article itself and not just a credit on the photo?” wrote one user.
“Not on my watch!” tweeted another user. “Sick of women in the room but not in the Nobel Prize room.”

Some people online proposed that the science community name the groundbreaking discovery after Bouman herself.
“Why not name it the Bouman Black Hole, and get scifi writers slip a reference into their characters' lines?” one Twitter user suggested. “‘Yes captain Bouman, that was the first black hole imaged by your ancestor using Earth's pre-warp imaging technology.’”
Meanwhile, other Twitter users began comparing Bouman to past female hidden figures including Rosalind Franklin, the pioneering molecular biologist who contributed to our modern understandings of DNA, and Margaret Hamilton, the largely unknown MIT female computer scientist who pioneered the “software” technology that landed astronauts on the moon.

“Computer scientist Katie Bouman and her awesome stack of hard drives for #EHTblackhole image data,” 

Nature News writer Flora Graham tweeted with an image of the two MIT computer scientists side by side. “Reminds me of Margaret Hamilton and her Apollo Guidance Computer source code.”
See all the best reactions to the Black Hole here:
https://pbs.twimg.com/profile_images/875374464334213120/un2sxt2O_normal.jpg


THE FIRST-EVER PICTURE OF A BLACK HOLE IS HERE! Computer scientist Katie Bouman led the development of the algorithm that made taking this picture possible. Watch her @TEDxBeaconSt talk to learn more: http://t.ted.com/MBrksnc  #EHTBlackHole

https://pbs.twimg.com/profile_images/73733019/Copy_of_Flora_03_normal.jpg

Computer scientist Katie Bouman and her awesome stack of hard drives for #EHTblackhole image data — reminds me of Margaret Hamilton and her Apollo Guidance Computer source code.


Monday, March 12, 2018

Melchizedek Prophecy - Weather Anomalies - Is this solar explosion another example hitting March 18?


We have tried to keep you informed of serious weather anomalies as predicted by Melchizedek.  As continuing record highs and lows continue in the USA along with strange storms on the east coast  could this be the latest example?


Many previous articles have focused on the potential impact of a properly aimed sunspot as it explodes on the Sun.  Other articles have discussed the spiritual concerns over the creation of the "Spider Web" of electromagnetic waves created by humans that are now blocking the essential naturally healing EM waves from the Sun.


Melchizedek has warned our proliferation of EM wave generating technologies, from smartphones to wifi to GPS, are preventing Earth from receiving the natural energy necessary to continue the healing and regeneration of the Earth.  If we cannot stop it the spirits will!


Upcoming Magnetic Storm Might Keep You Up At Night
NASA and Russian scientists warn the sun is reaching Solar Maximum.

Russian Story
Mar 11, 2018

Back up your data. Put a map in the glove department and, if you have vinyl and a turntable, or a transistor radio, you might want to break them out too. Oh and you might want to get some sleep. The Russian Academy of Sciences issued a report that an enormous geomagnetic storm will hit Earth on March 18.

The Russian scientists claim the coming storm may cause headaches and dizziness in people across the world. While there is no fear, at this time, that the disturbance will reach the capacity to affect power lines, it will disturb some people’s sleep.
Intense solar events send high levels of radiation, which interacts with our planet’s magnetosphere. “A geomagnetic storm is a major disturbance of Earth's magnetosphere that occurs when there is a very efficient exchange of energy from the solar wind into the space environment surrounding Earth,” according to the Space Weather Prediction Center’s National Oceanic and Atmospheric Administration. “The largest storms that result from these conditions are associated with solar coronal mass ejections (CMEs) where a billion tons or so of plasma from the sun, with its embedded magnetic field, arrives at Earth.”
The Sun has been very active lately. This will be the third storm this year to reach Earth. The first took place on January 15th. On February 19, NASA’s Solar Dynamics Observatory Satellite captured a solar flare releasing a coronal mass ejection big enough to interfere with radio communications, GPS signals, flight plans, national security and other electronics. The recent activity is the beginning of the upcoming solar maximum, which is due to peak in the next couple of years.
An unusually large CME happened on July 23, 2012, that had the capability of disrupting power grids. It missed the Earth by a margin of about nine days. The biggest solar storm on record was the Carrington Event, which hit Earth's magnetosphere on September 1–2, 1859. It occurred during a solar maximum about the same size as the one the earth is currently entering, according to NASA. The Carrington event damaged electric equipment like telegraph stations across the globe. Telegraph operators reported the storm caused sparks to shoot out of the equipment.  Northern lights could be seen as far south as Hawaii and Cuba and the northern United States. Southern lights were reported as far north as Chile.
The Laboratory of X-Ray Astronomy of the Sun is a subdivision of the Spectroscopy department in the Lebedev Institute of the Russian Academy of Science. Beginning in 1947, it caught the first X-ray image of the Sun in 1963. It is Russia’s leading design and construction center for space telescopes for solar research.

Thursday, November 16, 2017

CPT Internet Highlights - Star Refuses to Die

.

Science
This star refuses to die, even after it explodes


Swapna Krishna,Engadget


This star refuses to die, even after it explodes

Supernovae are some of the brightest and most energetic events in our galaxy. These occur when stars that have much greater mass than that of our sun explode; they become incredibly bright, and then slowly fade over the course of a few months as they lose energy. Under the terms of how we traditionally understand the life cycle of a star, a supernova inevitably means stellar death. Or does it? Astronomers working at Hawaii's Keck Observatory have found a star that refuses to die.
The supernova, named iPTF14hls, has exploded multiple times over the last fifty years. Rather than giving into death in the cold wastes of space, this singular star is seemingly in a cycle of continually absorbing matter, collapsing and exploding. The team first took note of the star in 2014 because it had gone supernova and was starting to fade. But then, a few months later, the team noticed that the star was becoming brighter again.
When the astronomers looked at records, they noticed that a supernova had occurred at that same location in 1954. The star had not only somehow survived, but had gone on to explode again in 2014. "This supernova breaks everything we thought we knew about how they work. It's the biggest puzzle I've encountered in almost a decade of studying stellar explosions," Iair Arcavi, the lead author of the study (which was published in Nature) said in a press release.
It's not clear why this star refuses to die, but it could have something to do with its size. It's at least 50 times more massive than our own star. Our conventional rules about how stars work might not apply to something of that size. The star could also have antimatter at its core that fuels its cycle of explosions, a hypothesized result of its extreme mass and temperature. Regardless of the reason, we appreciate this star's resilience
·         This article originally appeared on Engadget.


'ZOMBIE' STAR HAS BEEN EXPLODING FOR YEARS AND WILL NOT DIE
BY MEGHAN BARTELS ON 11/8/17

Usually, when something explodes, that's it—it's done. That's true even in space, where stars routinely blow themselves up. Now astronomers think they've spotted something remarkable: a star that has exploded twice and whose current explosion just keeps going. They reported their findings in a paper published Wednesday in the journal Nature.
Those findings are based on studying a star that scientists had written off as not being very interesting at first. Until, that is, an intern looked back at the data and saw something weird. "He saw it had faded and then gotten bright again, and that's what caught his attention," said first author Iair Arcavi, an astronomer at the University of California, Santa Barbara, and Las Cumbres Observatory. "That is very not normal. Supernovae are supposed to get bright and then fade."


The aftermath of a typical, short-lived supernova as it fades. NASA'S GODDARD SPACE FLIGHT CENTER/ESA/HUBBLE/L. CALCADA

But this one, called iPTF14hls, just kept going and going. First spotted in September 2014, it has brightened and dimmed five times since then, a phenomenon scientists had never seen before.
And when astronomers looked back at their records, they found something even weirder: An explosion in exactly the same part of the sky back in 1954. "We can't tell for sure that it's the same star exploding," Arcavi said. "But since supernovae are so rare and the galaxy is pretty small, we consider there's about a 95 to 99 percent chance that it's the same star."
Arcavi and his colleagues aren't positive yet what might be happening inside the star to cause such a weird pattern. But he pointed to a theory called pulsational pair instability as one possible explanation. Under this scenario, a star about 100 times as large as our sun could become so hot deep in its core that energy could turn into matter and antimatter, which would make the star unstable.
The star would then act like someone shoveling snow and gradually shedding outerwear: As it became unstable, it would eject a layer of mass, which would make it stable again for a limited time before heat builds up again. Each successive layer would eventually collide with its predecessor, which could explain the current pattern astronomers are seeing.

The yellow line traces the unprecedented cycle of brightening and dimming that astronomers have watched unfold.​LCO/S. ​WILKINSON.

But the pulsational pair instability theory doesn't perfectly match the data Arcavi and his colleagues had gathered. In particular, they found much more hydrogen in 2014 than they would have expected in a star that has already exploded, since hydrogen is the lightest element and therefore the easiest to lose.
"It's the theory that comes the closest to explaining this," Arcavi said of pulsational pair instability. "But it could also be something else. It could be something completely new, which is even more exciting."
It's unusual to even be able to keep watching a phenomenon like this every few days for three years, Arcavi added. Scientists have only caught the iPTF14hls antics thanks to a global network of robotic observatories that makes collecting data cheaper and easier. Fortunately, the same technique could increase astronomers' odds of seeing a similar event in the future—and coming one step closer to cracking the secret of the star that just doesn't want to die. 

CPT Internet Highlights - Antarctica Volcano Powerful as Yellowstone

.

Volcano 'as powerful as Yellowstone' MELTS ice beneath Antarctica
A GIGANTIC volcano which could be as powerful as the dreaded Yellowstone is melting Antarctic ice from beneath the surface, Nasa scientists have revealed.
PUBLISHED: 16:40, Thu, Nov 9, 2017 | UPDATED: 16:45, Thu, Nov 9, 2017


Volcano 'as powerful as Yellowstone' MELTS ice beneath Antarctica
GETTY
Experts working at the South Pole have found evidence to support a theory that a gigantic geothermal heat source may be lurking beneath the surface – and it could be as devastating as the Yellowstone volcano.
Scientists first theorised the ice was melting due to a volcano when they noticed a breathing effect was visible on Antarctica's Marie Byrd Land in the west of the icy continent.
The volcano itself is not a new discovery, but the new research suggests it could be aiding global warming and could be why the ice sheet collapsed 11,000 years ago in a previous example of rapid climate change.
HĆ©lĆØne Seroussi of Nasa's Jet Propulsion Laboratory (JPL) in Pasadena, California, said: "I thought it was crazy. I didn't see how we could have that amount of heat and still have ice on top of it.”


The land beneath the ice of Antarctica
Ms Seroussi and Erik Ivins of JPL used the Ice Sheet System Model (ISSM), which is a mathematical model that uses the physics of the ice sheets, to look for heat sources and meltwater deposits.
The melted water beneath the surface lubricates the ice sheets, allowing glaciers to slide.
And the information can also be used to estimate how much ice will be lost in the future.

"I didn't see how we could have that amount of heat and still have ice on top of it."
The underwater systems in the Antarctic can cause surface ice to rise by at least six metres over a short time frame, allowing scientists to observe concentrations of water sources beneath the surface.
In a statement, Nasa said: “They found that the flux of energy from the mantle plume must be no more than 150 milliwatts per square meter. 
 “For comparison, in US regions with no volcanic activity, the heat flux from Earth's mantle is 40 to 60 milliwatts.
"Under Yellowstone National Park – a well-known geothermal hot spot – the heat from below is about 200 milliwatts per square meter averaged over the entire park.”

Friday, October 13, 2017

A NASA satellite that monitors CO2 is revealing the inner workings of our planet

.
That’s key to figure out how our world will respond to climate change
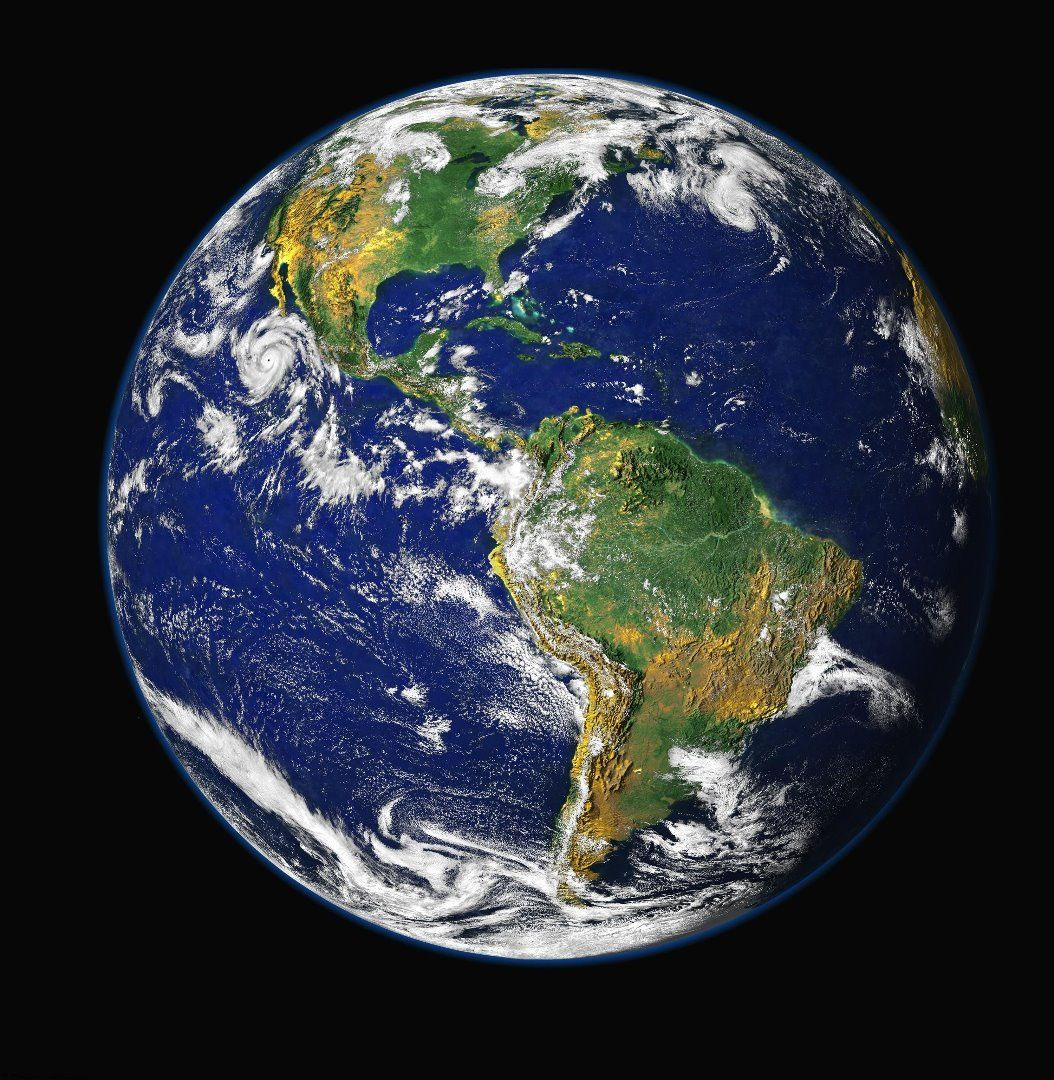
by Alessandra Potenza@ale_potenza  Oct 12, 2017, 2:00pm EDT


NASA is advancing new tools like the supercomputer model that created this simulation of carbon dioxide in the atmosphere to better understand what will happen to Earth’s climate if the land and ocean can no longer absorb nearly half of all climate-warming CO2 emissions. Image: NASA / GSFC

Thanks to a NASA satellite that’s been mapping the greenhouse gas carbon dioxide in the atmosphere in unprecedented detail, scientists are learning much more about how plants work, and how the land and oceans suck up and release CO2. This information could help us figure out how our world will respond to global warming.

New research shows that during the 2015–2016 El NiƱo, for instance, droughts, heat, and fires in tropical areas caused plants and soil on three continents to contribute to the largest growth of carbon dioxide on record. Plants use CO2 to grow, and they suck it out of the atmosphere. But during this event, because of little rain and higher than normal temperatures in South America, Africa, and Asia, some plants didn’t absorb as much CO2; others died and decomposed more quickly, releasing the carbon they’d pulled from the air. The newly observed behavior may provide clues for how the changing climate will create new feedback systems that can accelerate global warming.

The OCO-2 satellite, launched in 2014. Image: NASA / JPL-Caltech

These findings, published in one of five studies coming out today in Science, represent just the first batch of discoveries from a mission NASA launched in 2014. The satellite, called Orbiting Carbon Observatory-2, or OCO-2, is designed to monitor carbon dioxide in our planet’s atmosphere. CO2 levels have been increasing since the Industrial Revolution in the 1800s, and because CO2 is a heat-trapping greenhouse gas, our planet is warming up. Today, we keep pumping out huge amounts of carbon by burning fossil fuels, but about 25 percent of those emissions are absorbed by the ocean, and another 25 percent is vacuumed up by plants. Today’s papers are the beginnings of explanations about how this carbon is taken up, and if these processes will last as the world continues to warm.

“There’s a lot of uncertainty on what the world might be like in 100 years, and understanding more of what we’re seeing now can help us predict better what the future holds,” says Annmarie Eldering, the deputy project scientist for the OCO-2 mission at NASA’s Jet Propulsion Laboratory (JPL), and the co-author of a few of the studies.

The OCO-2 satellite zooms around the Earth over 14 times a day, gathering about 100,000 measurements per day — including in areas that haven’t been observed much before, like the middle of the ocean and the Amazon rainforest. Using that data, researchers put together a map of CO2 concentrations over the planet, to see how the gas is absorbed and emitted, and how it’s dispersed into the atmosphere.

This map shows how CO2 concentrations in the Northern Hemisphere change dramatically from season to season. Photo: A. Eldering et al., Science (2017)

One such map, described in one of the studies, shows how the Northern Hemisphere — where most continents are — is engulfed in carbon dioxide in the winter. But as the spring arrives and plants reactivate, concentrations take a nosedive. “To me, it was just like, ‘Wow!’” says Eldering. “It looked like some monster took a bite out of the carbon dioxide in those regions. I was amazed by how powerful the natural systems are.” Another study shows that the OCO-2 satellite can be used to track CO2 over really small areas, like volcanoes and cities like Los Angeles. That could be used not only to better understand city pollution, but also to predict when volcanoes will erupt.

As scientists keep delving through the first years of data, here are some of their major findings so far.

EL NIƑO

The OCO-2 satellite launched in July 2014, right before the beginning of one of the strongest El NiƱos ever. “It was just dumb luck,” says Scott Denning, a professor of atmospheric science at Colorado State University, who was not involved in the research. El NiƱo is a recurring climate pattern that brings warm waters to the tropical Pacific Ocean, affecting weather all over the globe. And the first El NiƱo the satellite observed was a doozy.

“IT WAS JUST DUMB LUCK.”

An extra 2.5 gigatons of CO2 was released into the air compared to 2011, when conditions were normal, one of the Sciencepapers reported. That extra carbon, about 25 million Statues of Liberty worth of mass, came from tropical areas in South America, Africa, and Asia — where plants all reacted differently. In South America, the plants’ growth was stunted by drought, causing them to vacuum up less CO2 than usual. In Africa, the heat caused dead plants to decompose more quickly, releasing high amounts of CO2. And in Asia, drought and heat caused forest fires, which also pumped huge quantities of carbon into the air.

In another study, researchers looked at how the same El NiƱo affected the ocean. Although the world’s oceans suck in about 25 percent of our CO2 emissions, different oceans behave differently: while the northern Atlantic absorbs CO2, the tropical Pacific usually releases CO2, says study co-author Abhishek Chatterjee, a scientist at University Space Research Association, working at NASA Goddard. That’s because powerful winds that blow east to west across the Pacific carry deep ocean water rich in CO2 to the surface. From there, part of that CO2 is leaked into the atmosphere.

But during El NiƱo, those winds weaken, bringing less CO2 to the surface. That means less carbon is dispersed into the air. But how little? The rate at which CO2 leaked from the tropical Pacific dropped as much as 54 percent between March and July 2015, the first months of El NiƱo, Chatterjee and his colleagues found. The concentrations of CO2 then skyrocketed as plants in South America, Africa, and Asia released huge amounts of carbon as described in the other Science paper.
“This is really a first for the carbon cycle community,” Chatterjee says. Scientists have long wondered how exactly CO2 fluctuates during El NiƱos, what roles the land and ocean play, and these papers finally provide some answers to these questions. “Observations from OCO-2 have solved that critical scientific puzzle,” Chatterjee says.

VOLCANOES AND CITIES

The OCO-2 satellite makes such high-resolution measurements that researchers can look at CO2 concentrations over very small areas, such as a city or a volcano. CO2 over Los Angeles, for instance, was higher in the winter, when plants absorb less CO2 and more plants die, than in the summer, according to one of the Science studies. It was also higher in urban areas, where there are more cars and power plant emissions, than in suburban areas, says lead author Florian Schwandner, an analytical geochemist at JPL. The findings show that the OCO-2 satellite can quickly scan cities for pollution, complementing ground-based measurements.

The Yasur volcano in Vanuatu, in 2006. Photo: Wikimedia Commons

The OCO-2 satellite can also be used to monitor active volcanoes, such as the Yasur volcano in Vanuatu, which constantly spews out a plume rich in CO2. The measurements suggest that Yasur is pumping out 41.6 kilotons of CO2 a day. When a volcano emits CO2, it means new batches of magma are moving toward the surface — a sign of unrest. So this new technique could be used to predict volcanic eruptions, Schwandner says. “We can’t stop a volcano, but we can evacuate people,” he says. “And the earlier we get the heads up the better.”

PHOTOSYNTHESIS

The OCO-2 satellite can also detect when plants take solar energy to grow, a process known as photosynthesis. During photosynthesis, plants emit a tiny amount of that energy back into the atmosphere, effectively glowing. This glow is invisible to the naked eye, but not to the OCO-2 satellite, which measures it at a much higher resolution than previous satellites like NASA’s Global Ozone Monitoring Instrument 2, according to another study published inScience.

“IT’S KINDA OF A DOUBLE WHAMMY.”

Detecting photosynthesis is key to understand whether plants are absorbing CO2. These measurements were used in one of the two El NiƱo papers, to figure out that during the 2015-2016 El NiƱo, plants in South America weren’t absorbing as much carbon. In the future, these worldwide observations of photosynthesis can be used to improve predictions of how productive crops will be in the future, as the world warms up, Eldering says.

All these observations have one main goal: to help us better understand the planet we live in — and how it’ll change in the future. And monitoring CO2 can help us unravel the mystery. “CO2 affects climate change, but also climate change affects CO2,” Denning says. “It’s kinda of a double whammy.”