
The Most Destructive
Storm in History about to Destroy Florida
according to the news media
As Hurricane Irma moves toward Florida perhaps it is time we
ask where is the media getting all the doom and gloom predictions that have
citizens throughout America glued to the television tube. Of course, we should never ignore storm
warnings, but is there a sinister force at work to keep us on edge, to keep us
trapped in fear, and if we are in the storm zone, and to keep us buying up a
mountain of storm supplies.

One wonders what is the source and reason for the dramatic,
life-threatening, predictions for the latest version of the worst storms in history. Melchizedek long ago said Florida would
weather any and all of the natural disasters we face in the next year without
facing utter destruction as the news media warns.

Of course, Florida will be hit, but not by the worst storm
in history. South Florida might get a
Category 1 or 2 storm and by the time Irma survives Miami and heads north, it
more than likely will be a tropical storm only.

As for the track of the hurricane, I think the media keeps
certain information from the public, information that would undermine the headlines
and prove much of the pre-hurricane hype of the media is not for the public interest
but for the profitability of the media advertisers.

Storm warnings are one of the most effective ways to get the
attention of the public, and to make sure you get the most attention, the more
dire the “breaking news” headlines the higher the ratings. Once the hotel are all booked, the
evacuations are underway, store shelves are empty, and gas pumps are dry, the
last 48-72 hours before the storm, truth starts to surface in the news reports.

Suddenly those deadly 185 to 225 mph winds circling the eye
of Dante’s beast stop being mentioned in the media because they were never
going to reach Florida. It will be more
like 100 mph winds hit and the Florida building code requires buildings
withstand over 135 mph. If the storm
hits in Miami, then Orlando and Jacksonville much farther north will only see a
weak tropical storm. Panic sells and
ratings soar the more hysterical the news forecasts.

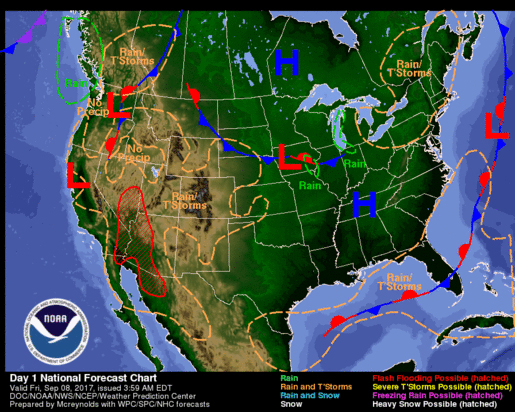
The one chart from NOOA, about the only source of
information that tells the truth, that might help give “honest” forecasts from the
news media they refuse to reference in real time because it might stop the hysteria
and slow down the panic buying of storm supplies.

Called the “Tropical Surface Analysis / NWS Unified Surface
Analysis.”
Here is the purpose of the map as stated by NOAA.
Purpose
The Tropical Surface Analysis is
created every six hours to depict the current state of atmosphere, specifically
the sea level pressure field and any relevant synoptic surface features. The
Tropical Surface Analysis is attached to surface analyses over North America,
the North Atlantic Ocean, the North Pacific Ocean, and the Western Pacific
Ocean to create the National Weather Service Unified Surface Analysis.

Content
The Tropical Surface Analysis
and NWS Unified Surface Analysis depict the sea level pressure field by showing
lines of equal pressure, usually in increments of four millibars (mb) but often
in increments of two millibars where the pressure gradient is weaker
(especially in the tropics). The analysis also depicts important surface
features that affect the weather, including areas of high and low pressure,
frontal systems (cold, warm, stationary, and occluded), troughs, tropical
cyclones, tropical waves, the Intertropical Convergence Zone (ITCZ), drylines,
and squall lines.

Coverage
The Tropical Surface Analysis is
created by the National Hurricane Center and covers the area approximately from
30°N to 20°S between 0° and 140°W. This area includes the tropical and
subtropical areas of the Atlantic and East Pacific Oceans, Mexico, Florida, the
Caribbean, South America, and West Africa. For radiofax purposes, the analysis
is split into three different areas:
1. Atlantic (East Half from 5°S to 50°N between 0° and 70°W)
2. Atlantic (West Half from 5°S to 50°N between 55°W and
125°W)
3. Eastern Pacific (from 20°S to 40°N between 70°W and
150°W)
The NWS Unified Surface Analysis
is created by merging the separate surface analysis produced by the National
Hurricane Center, the Weather Prediction Center, the Ocean Prediction Center,
and the Honolulu Weather Forecast Office. The total area spans from the equator
northward nearly to the North Pole, from 20°E westward to 130°W. This covers
the area from Europe and Central Africa westward across North and South America
to East Asia.

Look closely at the section zoomed and you will see a line
showing a High and Low line cutting through the middle of the state, it shows red
and blue marks. This is the leading edge
of a powerful front that will push Irma to the east. Out in the ocean you see a huge High that
will keep the storm moving up the east coast trapped between the High/Low front
and the High.

The same conditions have been forming the entire time Irma
has been tracked by the media but if this Tropical Surface Analysis / NWS
Unified Surface Analysis real time chart by NOAA was reported, we would have
known the damage zone was far, far, less than reported.

Truth seems to be evasive where ever you turn. However, give the government it’s due when
appropriate, NOAA DID report the truth, the news media chose to ignore it. As Melchizedek says, perhaps we should question
the source and seek the truth. It is
time for truth.
.
No comments:
Post a Comment